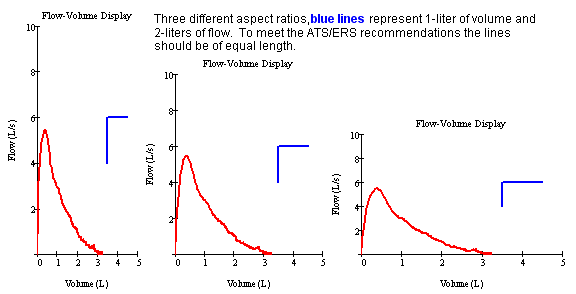
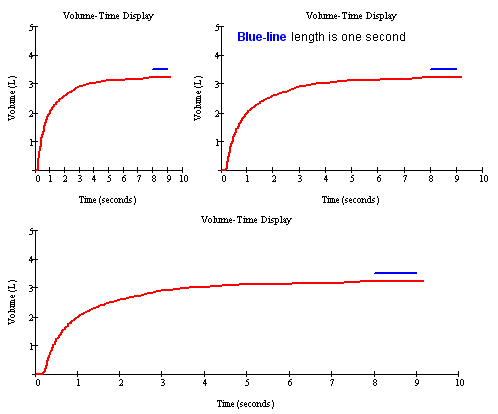
The Graph and Display size can significantly impact your ability to evaluate the quality of a curve - one of the most important functions while administering a spirometry test. Also, the Aspect Ratio (the flow-axis scale/size versus the volume-axis scale/size) can alter the appearance of the flow-volume curve. For this reason, the ATS/ERS have established a minimum graph/display size and set the aspect ratio to 2 to 1 (2 liters/second of flow for 1 liter of volume) for the flow-volume curve. For the volume-time curve, the time scale is important in determining whether a one-second plateau has been achieved. Below is the same flow-volume curve with three different aspect ratios and volume-time displays with three different time scales. The flow-volume on the far-right meets the ATS/ERS aspect ratio requirements. One important note, the graph size is very dependent on your screen size and resolution and the aspect-ratios may be affected as well. So, the curves below, may or may not meet the minimum ATS/ERS size requirements on your screen.
Below is the same volume-time curve plotted with three different time scales. The third, depending on our screen size and resolution, is closest to the ATS/ERS recommended minimum scale factors for volume and time.
It is important to note that aspect-ratios are especially important when looking at shapes of curves for identifying possible unacceptable maneuvers and lung disease patterns.